HyperGraph
2D & 3D Plotting and Data Analysis
Altair HyperGraph is a powerful data plotting and analysis tool that connects to a wide range of standard file formats. Its intuitive interface and advanced math engine make it easy to handle even the most complex mathematical equations.
HyperGraph combines these capabilities with high-quality display output and customer-specific customization features, forming a comprehensive data analysis system suitable for any organization.
|
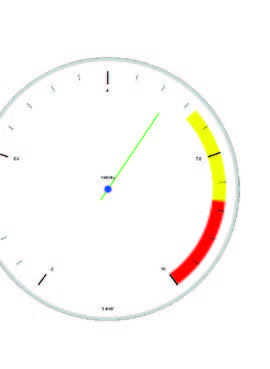
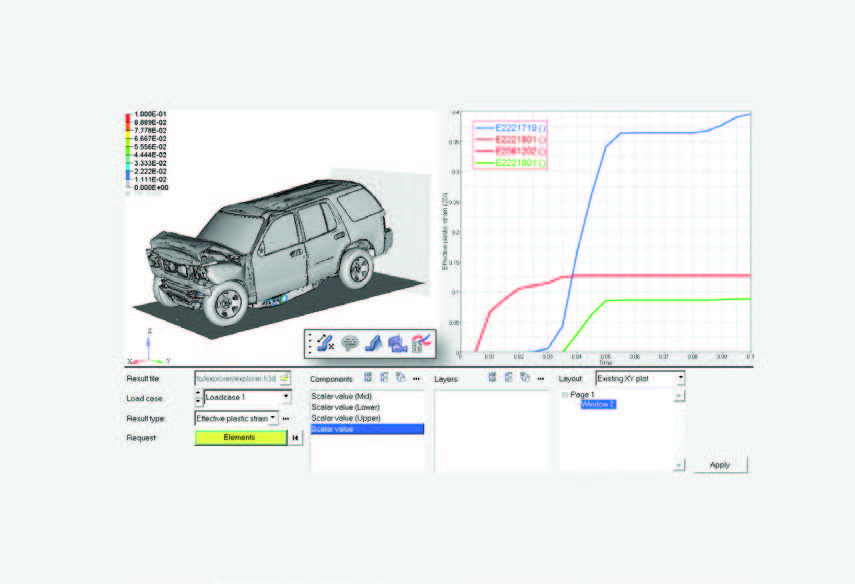
X-Y data animated as a scale gauge
|
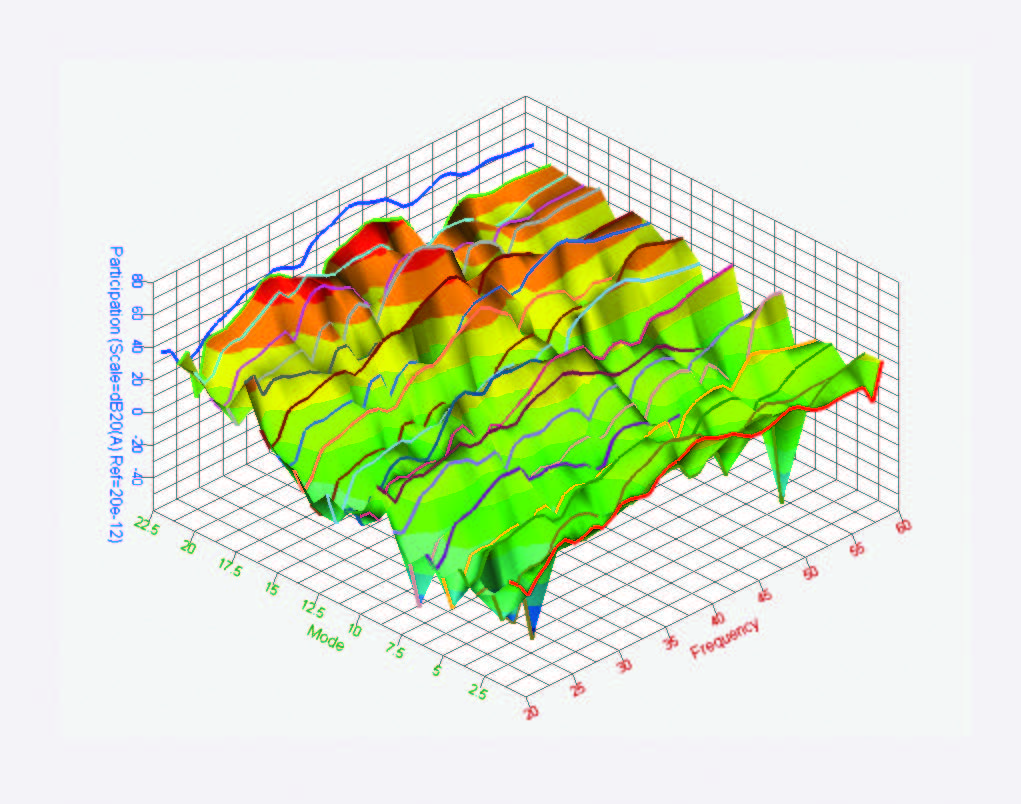
3D plot of modal contributions
|
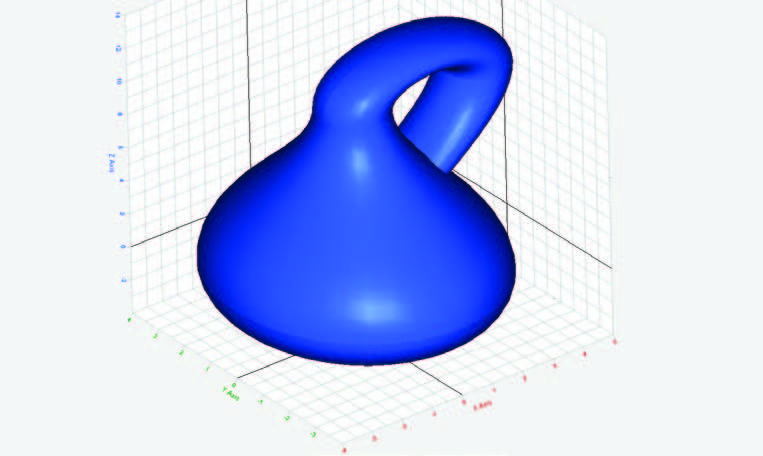
Bottle model in HyperGraph 3D
|
【 Product Highlights 】
- From one or more result files, plot large amounts of data in user-defined formats.
- Rapid repetitive plotting through report templates.
- Efficient comparison of results between different models and between simulation and test results.
- Fully automated generation of PPT reports.
- More than 200 built-in mathematical functions and controllers.
- Interfaces to over 130 data formats.
【 Advantages 】
HyperGraph provides intuitive plotting and data analysis for professional design and engineering test data:
- 2D and 3D plotting environment that outputs Cartesian, polar, complex, and bar plots; use HyperGraph 3D to draw 3D line and surface plots.
- Plot large volumes of data: based on raw files and channel information, use HyperGraph’s advanced plotting options to generate a fully annotated set of data plots from data files.
- Summary tables: for multi-plot, multi-page sessions, output summary tables with conditional formatting to efficiently review key performance indicators.
- Accelerate repetitive plotting: store multiple windows and pages as report templates for reuse when models change or are replaced.
- Browser wizards: adjust one or more plots simultaneously and perform mathematical operations on results via context menus.
- Marker tracking: track markers within the view and export displacement–time curves.
- Mathematical function library: extend Altair’s powerful math function library with user-defined functions.
- Simulation–test correlation: highly automated comparison of experimental and simulation results.
- Unit scaling: HyperGraph supports automatic unit scaling based on the original result files.
- Customizable interface: modify the interface and toolsets to build any engineering environment.
【 Increase Productivity 】
- Reports: automatically generate standard reports, plots, and tables, and use overlay reports for result comparison and correlation analysis.
- Plotting macros: use built-in factory macros to capture and replay frequently used data curves, improving plotting efficiency.
- Tcl/Tk scripting: automate workflows through a programmable command layer.
- Custom input/output templates: import and export XY plotting data.
- User-defined mathematical functions: create custom math functions in the interface, register existing C/Fortran routines, or access the HyperMath function library via HyperGraph’s HyperMath interface.
- Custom drop-down and text-related menus: provide easy access to reports, plotting macros, Tcl/Tk tools, and third-party executables.
- Configuration methods tailored for NVH, crash, forming, and multi-body dynamics analyses.
【 Plot Generator and Plot Details 】
.......HyperGraph’s automatic plot editor can directly generate a fully annotated set of Cartesian, polar, bar, and complex plots from engineering test data files, according to user requirements. Extensive formatting options allow users to specify plot appearance and page layout through the editor. The intuitive and efficient interface enables users to edit and modify the entire plot area, including axes, page footers, labels, and curve properties, all at once and across multiple plots.
【 Data Analysis 】
Create new mathematical curves by writing math functions or selecting from over 200 built-in math functions in the function library. HyperGraph also includes a sophisticated numerical engine to perform complex mathematical operations or build custom expressions, including:
- Impact damage
- Signal processing
- Curve fitting
- Filtering
- Eigen-system analysis
- Integration and differentiation
- Statistical analysis
- User-defined mathematical functions
- Custom expressions
【 Report Generation 】
.......Using HyperGraph’s “Publish PowerPoint” tool together with report templates makes generating standard reports much easier. Since the result information in HyperGraph can be synchronized with the exported PPT content, any changes made independently in Altair HyperViewTM can also be updated in the PPT file. Users can precisely control the output content and format. This feature supports all common image and video formats.
- Report output: PPT
- Synchronization: PPT plug-ins or HyperView
- Animation output: AVI, H3D, GIF
- Image output: BMP, JPEG, PNG, TIFF
- Summary data output: multi-column XY data
【 Supported Data Formats 】
HyperGraph supports more than 130 data formats, including the following commonly used formats:
- Altair@ Formats (.H3D, .abf)
- Abaqus (.odb and .dat)
- Adams
- ANSYS
- DADS
- DATX
- DIAdem
- Excel (.csv)
- HDF 5.0
- IS0/ IS0-MME 13499
- IS0 6487
- L5-DYNA
- Madymo
- Altair MotionSolve™
- Multi-column ASCII
- Nastran (.op2, .pch, .f06)
- nCode
- Altair OptiStruct™
- PAM-CRASH (.dsy and .thp)
- Altair Radioss™
- Ride data files
- RPC-3
- Universal Block 58 and XRF
- xy-data files
|
HyperGraph is part of the Altair HyperWorks™
framework
|
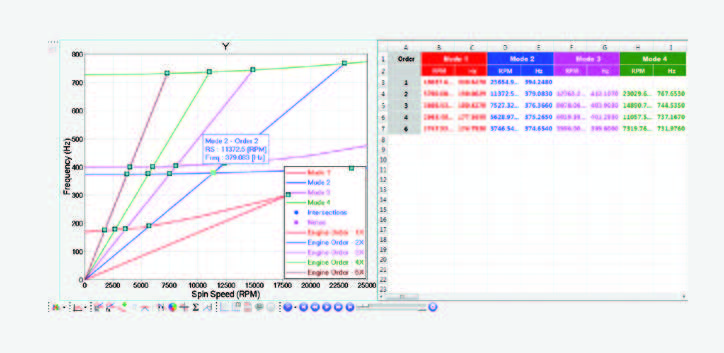
Campbell diagram in plot view and table view
|
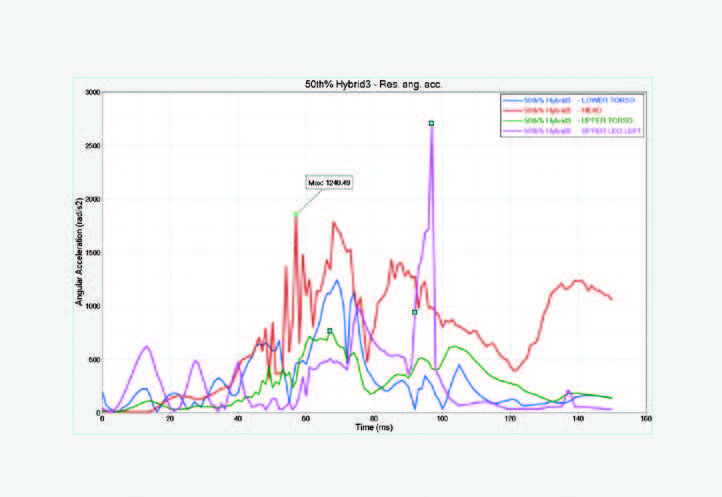
Values displayed on mouse hover to improve readability
|
Richin Technology is a “CAE and AI data analytics expert”, and we have completed many successful case studies.
▶ Contact us now to get more information.
▶ Subscribe to our Richin YouTube channel to explore more CAE and data analytics content.


